HITRAN parameters
In this section we describe the definition, units and basic usage of the HITRAN spectral line parameters.
$h \equiv 6.62607015 \times 10^{-27}\;\mathrm{erg\, s}$
$c \equiv 2.99792458 \times 10^{10}\;\mathrm{cm\,s^{-1}}$
$k \equiv 1.380649 \times 10^{-16}\;\mathrm{erg\,K^{-1}}$
$c_2 = 1.4387769 \; \mathrm{cm\,K}$
Firstly, parameters that were provided in the ASCII files since the HITRAN2004 edition[1] are defined and then the new parameters and parametrizations are discussed. Some of these parameters are shown schematically in Fig. 1. In the following discussion, $h$ (erg·s), $c$ (cm/s), and $k$ (erg·K) are the Planck constant, speed of light, and Boltzmann constant, respectively and $c_2 \equiv hc/k$ the second radiation constant. Note that the units in HITRAN are not SI, but are usually cgs for historical reasons as well as ease of use as input to most radiative-transfer codes.
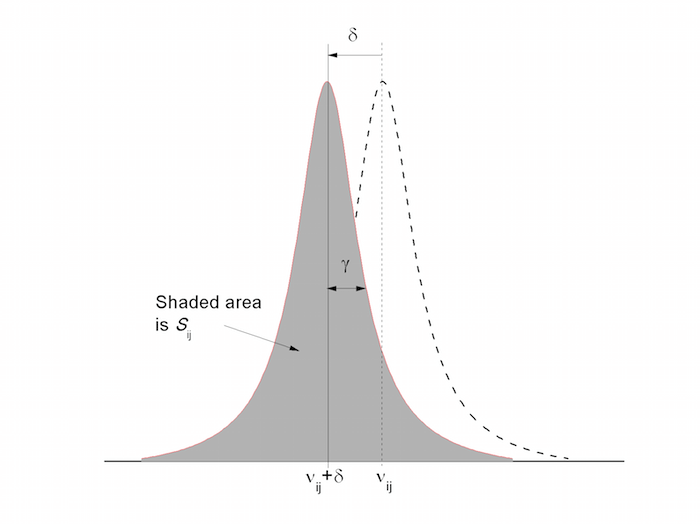
Figure 1. Schematic of fundamental spectroscopic parameters of a line transition in HITRAN. The dotted line refers to a transition at zero pressure with a negative pressure shift, $\delta$). The Lorentzian profile is assumed in this figure.
| Parameter | Description |
|---|---|
| Mol |
The molecular species identification (ID) numberCurrently HITRAN uses Mol = 1 (for H2O) through 47 (for SO3). Mol has no intrinsic meaning; a molecule is assigned a sequential number in the chronological order of its introduction into HITRAN. The IDs and corresponding molecules are listed here. |
| Iso |
The isotopologue ID numberIso = 1 for the most abundant (by a chosen terrestrial determination) isotopologue, Iso = 2 for the next most abundant, etc. An isotopologue is a molecular twin, as it were, that differs from the original molecule in the isotopic composition (number of isotopic substitutions) only; for example, 13CH4 and 12CH3D are isotopologues of 12CH4. An isotopomer (a contraction of ‘isotopic isomer’), on the other hand, has the same number of each of the isotopic atoms but differing in their orientation within the molecular structure (giving rise to different spectra), for example 16O18O16O is an isotopomer of 16O16O18O and so is 14N15NO of 15N14NO. An isotopologue description shorthand, called the AFGL notation, is often used such that, for example, 16O13C16O is referred to as CO2 636 (Mol = 2, Iso = 2). A list of the gases and isotopologues is given here and in the file molparam.txt. Note that every non-radioactive isotopologue of every molecule has a natural terrestrial isotopic abundance, $I_\mathrm{a}$, associated with it. One should keep in mind, however, that in reality the isotopic abundance varies across the globe (not to mention universe). These numbers in HITRAN are calculated from arbitrarily chosen atomic abundances from P. De Bièvre et al.[3]. For applications that do not assume this isotope mixture, for example studies of other planetary atmospheres, this weighting should be renormalized by the user. |
| $\nu_{ij}$ |
The wavenumber of the spectral line transition (cm-1) in vacuumThe transition between lower and upper states $i$ and $j$ is accompanied by the emission or absorption of a photon of energy $\Delta E = E_i - E_j = \nu_{ij}\;\mathrm{cm^{-1}}$. Other designations use double primes and primes ($''$ and $'$) for lower and upper states, respectively. International definition also calls for a tilde over the $\nu$ to denote wavenumber as $\tilde{\nu}$, but we have dropped that convention. |
| $S_{ij}$ |
The spectral line intensity ($\mathrm{cm^{-1}/(molecule·cm^{-2}})$) at $T_\mathrm{ref} = 296\;\mathrm{K}$The intensity is defined here for a single molecule, per unit volume. The units have been shown in this form (unreduced to cm/molecule) in order to emphasize that the intensity can be thought of as wavenumbers per column density, as commonly used in atmospheric transmission and radiance codes. It can be visualized as a shaded area under the line contour in Fig. 1. The spectral line intensity of the transition between two rovibronic states is given as \begin{equation} S_{ij} = I_\mathrm{a}\frac{A_{ji}}{8 \pi c \nu_{ij}^2}\frac{g'e^{-c_2E''/T}\left( 1 - e^{-c_2\nu_{ij}/T} \right)}{Q(T)} \label{eqn-line-intensity} \end{equation} where $A_{ji}\;(\mathrm{s^{-1}})$ is the Einstein coefficient for spontaneous emission, $g'$ is the upper state statistical weight, and $E''=E_i$ is the lower state energy ($\mathrm{cm^{-1}}$) (see discussion of these parameters below). The total internal partition sum, $Q(T)$, is given by \begin{equation} Q(T) = \sum_k g_k \exp\left(-\frac{c_2E_k}{T}\right). \label{eqn-partition-sum} \end{equation} This is the definition that appears in HITRAN. It should be reemphasized that $S_{ij}$ is weighted according to the natural terrestrial isotopic abundances, $I_\mathrm{a}$, given here and in the file molparam.txt |
| $A_{ji}$ |
The Einstein-A coefficient (s-1) of a transitionIn cgs units for which $\epsilon_0 = (4\pi)^{-1}$, $\mu_0 = 4\pi/c^2$. Electric dipole$$g'A_{ji} = \frac{64\pi^4}{3h}\nu_{ij}^3g''\mathfrak{R}_{ij}$$Magnetic dipole$$g'A_{ji} = \frac{64\pi^5}{3hc}\nu_{ij}^3g''\mathfrak{R}_{ij}$$Electric quadrupole$$g'A_{ji} = \frac{32\pi^6}{5h}\nu_{ij}^5g''\mathfrak{R}_{ij}$$This quantity is defined in Eq. (\ref{eqn-einstein-a}). It is related to other parameters in each HITRAN transition record (with the addition of data outside the main line list including the partition sum $Q(296\;\mathrm{K})$ and the isotopologue abundance). $A_{ji}$ has the advantage of being independent of temperature and isotopologue abundance. Note that editions of HITRAN between 1992 and 2000 employed the weighted transition-moment squared, $\mathfrak{R}_{ij}$ ($\mathrm{Debye^2} \equiv 10^{-36} \mathrm{erg\cdot cm^3}$) instead of $A_{ji}$. It was replaced in later editions by $A_{ji}$ as the latter quantity is more applicable in astrophysics and because it is independent of the type of transition. The majority of the transitions in HITRAN are produced by electric dipole. However, there are some transitions that are magnetic-dipole (oxygen) and also electric quadrupole (nitrogen and some oxygen transitions). The Einstein coefficient, $A_{ji}$ is related to $\mathfrak{R}_{ij}$ for electric dipole transitions by \begin{equation} A_{ji} = \frac{64\pi^4}{3h}\nu_{ij}^3\frac{g''}{g'}\mathfrak{R}_{ij} \times 10^{-36}. \label{eqn-einstein-a} \end{equation} |
| $\gamma_{air}$ |
The air-broadened half width at half maximum (HWHM) ($\mathrm{cm^{-1}/atm}$) at $T_\mathrm{ref} = 296\;\mathrm{K}$ and reference pressure $p_\mathrm{ref} = 1\;\mathrm{atm}$See below for details about how to calculate the spectral line shape from this parameter. |
| $\gamma_{self}$ |
The self-broadened half width at half maximum (HWHM) ($\mathrm{cm^{-1}/atm}$) at $T_\mathrm{ref} = 296\;\mathrm{K}$ and reference pressure $p_\mathrm{ref} = 1\;\mathrm{atm}$See below for details about how to calculate the spectral line shape from this parameter. |
| $E''$ |
The lower-state energy of the transition (cm-1)This quantity has been defined such that the minimum possible level of the particular isotopologue is set to zero. The HITRAN database (HITRAN2012 and most earlier editions) used an integer value of minus one (-1) as a flag for some unidentified transitions whose lower-state energy is unknown, but where confidence in the intensity at 296 K is achieved. |
| $n_\mathrm{air}$ |
The coefficient of the temperature dependence of the air-broadened half widthSee below for details about how to calculate the spectral line shape from this parameter. The temperature dependences of other parameters are being added to the database over time. |
| $\delta_\mathrm{air}$ |
The pressure shift ($\mathrm{cm^{-1}/atm}$) at $T_\mathrm{ref} = 296\;\mathrm{K}$ and $p_\mathrm{ref} = 1\;\mathrm{atm}$ of the line position with respect to the vacuum transition wavenumber $\nu_{ij}$Note that shifts can be both negative and positive depending on the transition. In Fig. 1 the shift shown is negative which is most common. Up until the HITRAN2012 database [2], only shifts due to air were provided; however self shifts, H2-, He- and CO2-induced shifts are now also being provided for some species. |
| $g'', g'$ |
The lower and upper state statistical weightsThese parameters are explained in Šimečková et al.[4]. The weight includes electronic, vibrational, rotational, and nuclear statistics; caution must be exercised when calculating weights for degenerate states. |
Applications
Temperature dependence of the line intensity
To calculate the intensity at temperatures different from the HITRAN reference temperature of 296 K, one uses the following expression, which is derived from Eq. (\ref{eqn-line-intensity}): \begin{equation} S_{ij}(T) = S_{ij}(T_\mathrm{ref}) \frac{Q(T_\mathrm{ref})}{Q(T)} \frac{\exp\left( -c_2 E''/T \right)}{\exp\left( -c_2 E''/T_\mathrm{ref} \right)} \frac{[1-\exp\left( -c_2 \nu_{ij}/T \right)]}{[1-\exp\left(-c_2 \nu_{ij}/T_\mathrm{ref} \right)]}. \label{eqn-intensity-temperature-dependence} \end{equation} The ratio of total internal partition functions can be calculated using the values from 70 to 3000K that are provided in the FORTRAN program TIPS.for associated with the HITRAN compilation. These values are an improvement over the usual classical approximation using a product of the independent temperature variation of the rotational and vibrational components of the partition function. The third factor on the right in Eq. (\ref{eqn-intensity-temperature-dependence}) accounts for the ratio of Boltzmann populations, and the fourth factor for the effect of stimulated emission. In the limit $c_2\nu_{ij} \gg T$ (at "high" wavenumbers) this factor is approximately 1.
Note that going well above 296K may cause errors due to missing hot bands in HITRAN that become significant at higher temperatures.
Temperature and pressure dependence of the line width
When one works with the database, the Voigt line shape is usually assumed, which is a convolution of a Gaussian (Doppler-broadened) profile, $f_\mathrm{G}(\nu)$, and Lorentzian (pressure-broadened) profile, $f_\mathrm{L}(\nu)$.
The half-width at half-maximum (HWHM) of the Doppler-broadened component is given by
$$ N_\mathrm{A} = 6.02214129 \times 10^{23}\;\mathrm{mol^{−1}} $$
Isotopologue masses are given here and in the file molparam.txt.
It is important to remember to use cgs units throughout if using Eq. (\ref{eqn-gaussian-hwhm}); alternatively, use SI units throughout (including $c$ in $\mathrm{m\,s^{-1}}$) but leave $\nu_{ij}$ in $\mathrm{cm^{-1}}$.
\begin{equation}
\alpha_\mathrm{D}(T) = \frac{\nu_{ij}}{c}\sqrt{\frac{2 N_\mathrm{A}kT\ln 2}{M}}, \label{eqn-gaussian-hwhm}
\end{equation}
where $M$ is the molar mass of the isotopologue in grams and $N_\mathrm{A}$ is the Avogadro constant.
The Lorentzian (pressure-broadened) HWHM, $\gamma(p,T)$ for a gas at pressure $p$ (atm), temperature $T$ (K) and partial pressure $p_\mathrm{self}$ (atm) is calculated as: \begin{equation} \gamma(p, T) = \left( \frac{T_\mathrm{ref}}{T} \right)^{n_\mathrm{air}}\left( \gamma_\mathrm{air}(p_\mathrm{ref}, T_\mathrm{ref})(p-p_\mathrm{self}) + \gamma_\mathrm{self}(p_\mathrm{ref}, T_\mathrm{ref})p_\mathrm{self}\right). \label{eqn-gamma-pt} \end{equation} In the absence of other data, the coefficient of temperature dependence of the self-broadened half width has been assumed to be equal to that of the air-broadened half width.
Pressure shift correction of line position
The pressure shift, $\delta$, of the transition wavenumber leads to a shifted position $\nu_{ij}^*$ given by \begin{equation} \nu_{ij}^* = \nu_{ij} + \delta(p_\mathrm{ref}) p. \label{eqn-pressure-shift} \end{equation} The pressure shift should also include a temperature dependence, but that effect was not included in HITRAN until now. In fact, the availability of shift values is still sparse, and the experimental values have high uncertainties associated with them.
Absorption coefficient
In the atmosphere, a spectral line is broadened about the transition wavenumber $\nu_{ij}$, the spread being represented by the normalized line shape function $f_\mathrm{L}(\nu; \nu_{ij}, p, T)$ (1/cm-1). In the lower atmosphere, pressure broadening of spectral lines dominates and if a Lorentz profile can be assumed, \begin{equation} f_\mathrm{L}(\nu; \nu_{ij}, T, p) = \frac{1}{\pi}\frac{\gamma(p,T)}{\gamma(p,T)^2 + [\nu-(\nu_{ij} + \delta(p_\mathrm{ref})p)]^2} \label{eqn-lorentzian-profile} \end{equation} In the low-pressure environment of the upper atmosphere Doppler-broadening dominates the line shape and a Gaussian profile can be assumed: \begin{equation} f_\mathrm{G}(\nu; \nu_{ij}, T) = \sqrt{\frac{\ln 2}{\pi\alpha_\mathrm{D}^2}}\exp\left(-\frac{(\nu - \nu_{ij})^2\ln 2}{\alpha_\mathrm{D}^2}\right) \label{eqn-gaussian-profile} \end{equation} Note that the line shape function for many applications is much more complex. In the not-so-distant past, transmission and radiance codes applied the Voigt function, which is a convolution of a Lorentzian function (valid at the surface of the Earth and easily calculated using the parameters within HITRAN, Eq. (\ref{eqn-gamma-pt})) and a Gaussian function (accounting for the Doppler broadening and valid at very high altitudes; its HWHM is easily calculated knowing the temperature and mass of the molecule, see Eq. (\ref{eqn-gaussian-hwhm})). More sophisticated line shape functions[5, 6] are now being applied to account for details in the collisions that give rise to the line shape. HITRAN has started to include these effects.
The monochromatic absorption coefficient $k_{ij}(\nu,T,p)$ (1/(molecule cm-2)) at wavenumber $\nu$ (cm-1) due to this transition is then given by \begin{equation}k_{ij}(\nu,T,p) = S_{ij}(T) f(\nu; \nu_{ij}, T, p) \label{eqn-absorption-coeff} \end{equation}
The dimensionless optical depth $\tau_{ij}(\nu,T,p)$ is formed by multiplying the absorption coefficient by the column number density of absorbing molecules, $u$ (molecules cm-2), such that \begin{equation} \tau_{ij}(\nu,T,p) = u k_{ij}(\nu,T,p) \label{eqn-optical-depth} \end{equation} The column number density is the integral of the volume number density, $[\mathrm{X}]$ of the absorbing molecules, X, along the path of interest: $$ u = \int_l [X]\,\mathrm{d}l. $$ In particular if $[\mathrm{X}]$ is constant along the path of interest, then $u = [\mathrm{X}]l$.
References
[1] L. S. Rothman, et al., "The HITRAN 2004 molecular spectroscopic database", J. Quant. Spectrosc. Radiat. Transfer 96, 139-204 (2005).
[2] L. S. Rothman, et al., "The HITRAN 2012 Molecular Spectroscopic Database", J. Quant. Spectrosc. Radiat. Transfer 130, 4-50 (2013).
[3] P. De Bièvre, N. E. Holden and I. L. Barnes, "Isotopic Abundances and Atomic Weights of the Elements", J. Phys. Chem. Ref. Data 13, 809-891 (1984).
[4] M. Šimečková, D. Jacquemart, L. S. Rothman, R. R. Gamache, and A. Goldman, "Einstein A-coefficients and statistical weights for molecular absorption transitions in the HITRAN database", J. Quant. Spectrosc. Radiat. Transfer 98, 130-155 (2006).
[5] J. Tennyson et al., "Recommended isolated-line profile for representing high-resolution spectroscopic transitions (IUPAC Technical Report)", Pure Appl. Chem. 86, 1931-1943 (2014).
[6] N. H. Ngo, D. Lisak, H. Tran, J.-M. Hartmann, "An isolated line-shape model to go beyond the Voigt profile in spectroscopic databases and radiative transfer codes", J. Quant. Spectrosc. Radiat. Transfer 129, 89-100 (2013) ; Erratum: J. Quant. Spectrosc. Radiat. Transfer 134, 105 (2014).